Beyond Flood Maps: Measuring What Flooding Could Cost Pontianak
A preliminary actuarial study is helping translate Pontianak’s flood hazards into estimates of potential financial loss, an important step toward stronger public-asset planning, climate adaptation, and disaster-risk financing.
When floodwater enters a school, health centre, government office, or other public facility, the consequences extend beyond the visible waterline. Buildings may require repair, equipment may be damaged, essential services may be interrupted, and limited public budgets may need to be redirected towards recovery.
Flood-hazard maps can show where water may reach and how deep it may become. However, they do not automatically tell decision-makers how much damage a flood could cause, which assets may face the greatest losses, or how much funding should be prepared before the next disaster.
A study, developed by researchers from Universitas Gadjah Mada with support from the Canada-funded FINCAPES Project through the University of Waterloo, bridges this gap, it applies an actuarial catastrophe-modelling approach to estimate direct economic losses from flooding in Pontianak.
The research is designed to translate physical flood assessments into financial-risk estimates. It examines potential losses under different climate and flood scenarios and seeks to generate decision-making indicators such as Average Annual Loss, or AAL, supported by estimates of losses associated with different probabilities of occurrence.
A city facing compound flood risks
Pontianak’s flood challenge is shaped by several interconnected conditions.
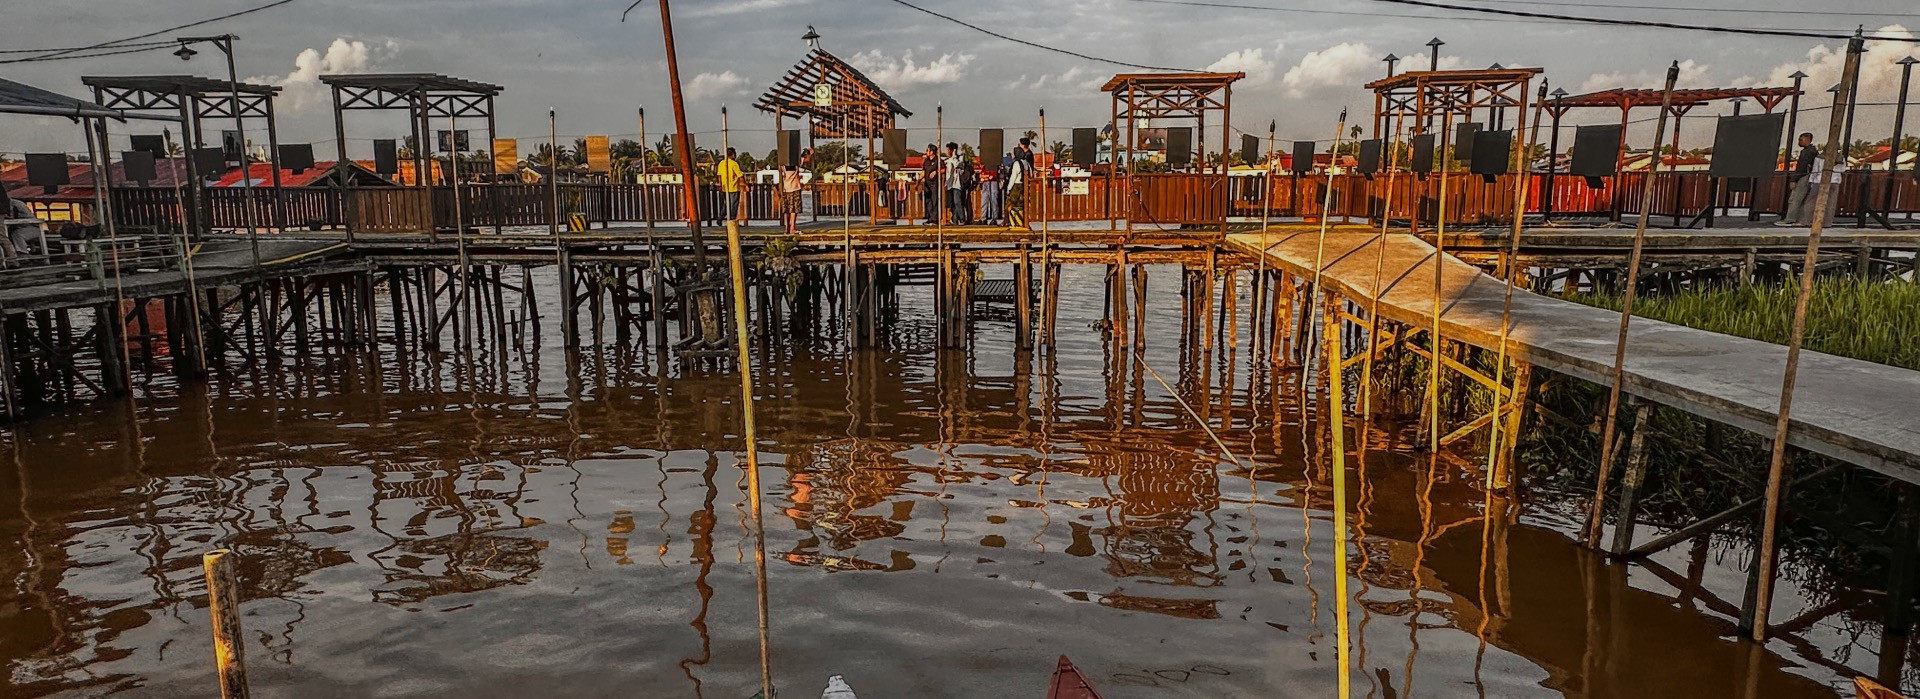
The city lies on predominantly flat terrain, much of it only 0.1 to 2 metres above sea level. Its position at the confluence of the Kapuas and Landak rivers makes it vulnerable to riverine flooding, while high rainfall also creates surface-water and drainage pressures. Rising sea levels, environmental degradation, rapid urban development, and land subsidence further increase the risk.
Previous hazard analysis presented in the study indicates that flood depths under a 100-year return-period scenario could exceed 4.28 metres in some locations. It also estimates that approximately 64 per cent of the population, or around 415,000 residents, may live in high-risk areas, with disproportionate impacts on low-income settlements.
These overlapping factors mean that Pontianak is not dealing with a single source of flooding. River discharge, intense rainfall, drainage constraints, sea-level rise, and land conditions may combine to create what researchers describe as compound flood risk. Understanding this physical hazard is essential. But effective preparedness also requires cities to understand what lies in the flood’s path and what the financial consequences could be.
From water depth to rupiah loss
The study uses a catastrophe-modelling framework that brings together three components: hazard, exposure, and vulnerability. Hazard describes the flood itself, including its potential depth, extent, and severity under different scenarios. Exposure identifies the buildings and assets located within the affected area and estimates their value. Vulnerability examines how much damage different types of buildings may experience at different water depths.
These components allow the model to move from a physical question on “How deep could the water become?” to a financial one on “How much damage could that water cause?” This distinction is important for government planning. Two buildings exposed to the same flood depth may experience different levels of loss depending on their construction, use, replacement value, and sensitivity to water damage.
By estimating these differences, actuarial modelling can help decision-makers understand not only where flooding may occur, but also where the greatest financial exposure may be concentrated.
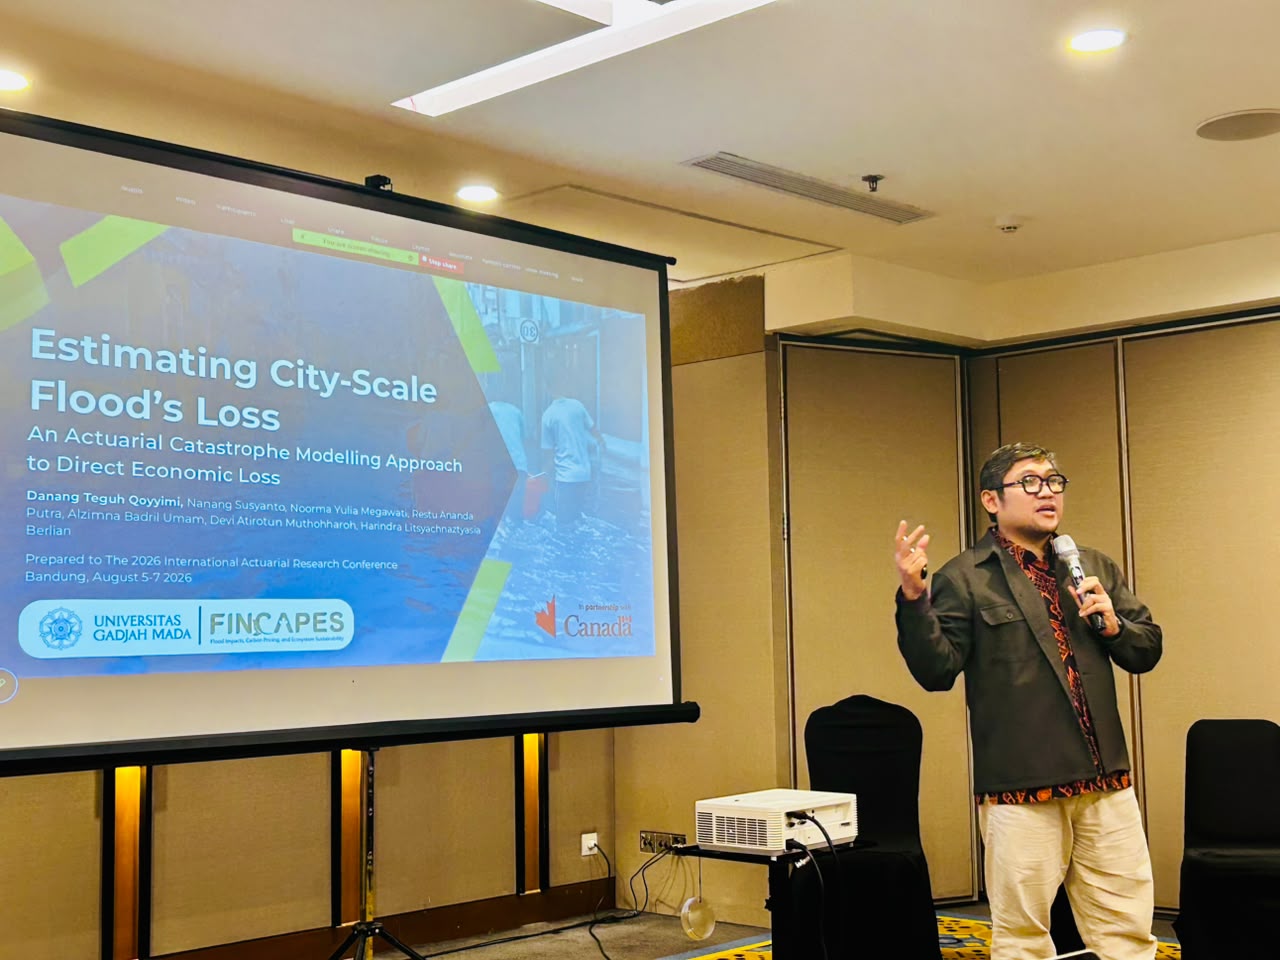
The preliminary findings of the Pontianak city-scale flood-loss study is presented at the 2026 International Actuarial Research Conference in Bandung. The study is led by the Actuarial Research Group, the Department of Mathematics, the Faculty of Mathematics and Natural Sciences at Universitas Gadjah Mada.
Nearly IDR 1 trillion in public assets assessed
The preliminary findings presented at the 2026 International Actuarial Research Conference in Bandung, 5-7 August 2026 showcases simulation that covers 251 prioritised public and government assets in Pontianak. These assets have an estimated reconstruction-cost baseline, referred to in the study as the Total Sum Insured, of approximately IDR 965.57 billion. This figure is used as a common baseline for comparing the estimated losses generated by different flood scenarios.
The study shows that direct loss ratios increase as flood events become more severe. For the assets included in the preliminary analysis, the estimated loss ratio rises from approximately 0.0012 for a two-year return-period event to around 0.00182 for a 100-year event.
Although the percentages may appear small when viewed as ratios, they are applied to a substantial portfolio of public assets. More importantly, the analysis shows how losses accumulate across facilities and how rare but severe events can change a city’s overall financial-risk profile.
Why extreme events matter
One of the most important findings is that the estimated Average Annual Loss varies significantly depending on the calculation method used.
A basic trapezoidal calculation produces an estimated AAL of approximately IDR 622.6 million. This method relies on the flood scenarios that have already been observed or modelled and does not mathematically extend the estimate to less frequent events outside that range.
A second approach tests several probability distributions to better account for rare, high-impact events. Under the best-performing heavy-tailed distributions, the estimated AAL increases to approximately IDR 1.05–1.15 billion.
The difference between these estimates illustrates an important issue in disaster-risk financing: severe losses may be concentrated in events that occur infrequently but have disproportionately large consequences.
When these extreme-event risks are not sufficiently represented, governments, insurers, and other institutions may underestimate the level of funding required for future disasters.
The study therefore highlights the importance of using risk metrics that are sensitive to the “tail” of the loss distribution, the portion representing rare but potentially catastrophic events.
Better financial modelling begins with better data
The research also revealed a significant challenge in the availability and quality of public-asset information. The study initially compiled 1,432 records from 16 local government agencies. After removing duplicate, irrelevant, incomplete, or technically unusable entries, only 361 records—or 25.2 per cent of the original dataset, met the minimum requirements for further modelling.
There are two major gaps limited the analysis. First, many records did not contain sufficiently accurate geographic coordinates. Without reliable latitude and longitude information, it is difficult to determine whether a building lies within a particular flood zone or is exposed to a specific water depth. Second, many records lacked reliable replacement-cost estimates. This information is essential for calculating how much it would cost to repair or reconstruct an affected asset.
The modelling process also required building footprints, while much of the administrative information was available only as point coordinates. Researchers therefore tested several methods for matching government asset records with mapped building polygons.
These challenges show that improving disaster-risk analysis is not only a technical modelling exercise. It also depends on stronger public-asset management, consistent data standards, and coordination between government agencies.
A comprehensive, geolocated, and regularly updated public-asset inventory would support not only flood-risk modelling, but also infrastructure planning, budgeting, maintenance, insurance, and post-disaster recovery.
Protecting essential public services
The preliminary analysis suggests that expected losses are heavily concentrated in education and healthcare facilities. This finding has direct implications for adaptation planning. Schools and health facilities provide essential public services, including during and after disasters. Damage to these buildings can therefore create consequences that extend beyond reconstruction costs, disrupting education, medical care, emergency response, and community recovery.
The study recommends prioritising these asset categories in the next phase of data collection and considering targeted structural reinforcement to reduce their vulnerability. Financial-risk estimates can help authorities determine where limited adaptation resources may have the greatest public benefit. They can support decisions about which facilities should be strengthened, elevated, relocated, better protected, or prioritised in emergency planning.
Measuring resilience in metres and rupiah
Flood-risk management has traditionally focused on physical indicators: rainfall levels, water depth, inundation area, and the frequency of extreme events. These indicators remain fundamental. But cities also need to understand the financial implications of those hazards.
By connecting flood maps with asset values and estimates of physical damage, the Pontianak study demonstrates how hazard science can be translated into information that is directly relevant to budgeting, infrastructure protection, insurance, and public policy.
The preliminary results provide an early indication of the scale of public-asset exposure, while also showing how much uncertainty remains when asset data are incomplete and extreme-event risks are not fully captured.
For Pontianak and other flood-prone cities, preparing for the next flood requires knowing not only where the water may go, but also what may be lost, which services are most at risk, and how much financial protection will be needed to recover.